|
Vegetation Data
|
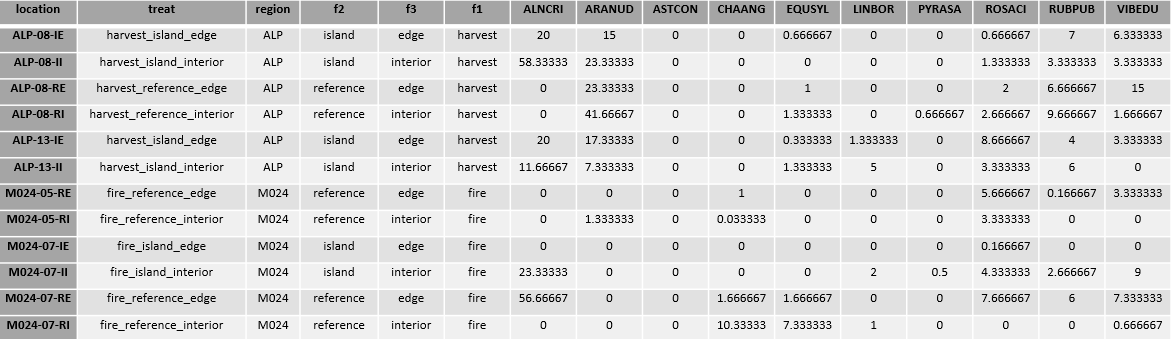
Figure 8. Response variable table containing treatment levels and averaged percent cover of each species within a plot
Environmental Variables
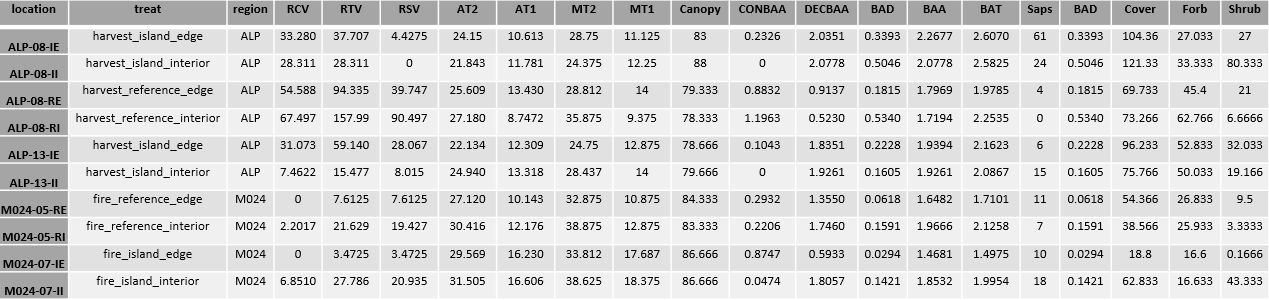
Figure 9. Explanatory variable table containing treatment levels, and forest structure variables
Breakdown of Variables
The following variables are used to distinguish samples :
Vegetation data variables:
Explanatory data variables:
- Location: A unique code detailing the plot
- Treat: An identifier to specify the combined treatments
- Region: Which fire or harvest area the plot was sampled
- F1: Disturbance type (Fire/Harvest)
- F2: Location (Island/Reference)
- F3: Position (Edge/Interior)
Vegetation data variables:
- Species are presented in 6 letter codes comprised of the first three letters of their genus followed by the first three letters of their specific epiphet. For example, ARANUD is Aralia nudicaulis (L.). A partial list of understory species is included in the appendix. Species cover is presented as the average of the three vegetation subplots of each plot. The cover was averaged to avoid issues with subsamples and assumptions of independant observations.
Explanatory data variables:
- RCV: Volume (m3) of decay class 1 & 2 coarse woody debris (diameter >7 cm), representing trees that died and fell over following the disturbance
- RSV: Volume (m3) of decay class 1 & 2 standing deadwood (diameter >9.1 cm), representing trees that died following the disturbance
- RTV: Sum of RCV and RSV
- AT2: Average forest floor temperature (°C) of the hottest time of the day(14:00-16:00) of the 5 hottest days of the summer as described in (CITATION). This captures the temperatures most physiologically stressful to plants
- MT2: Highest forest floor temperature (°C) of the hottest time of the day(14:00-16:00) of the 5 hottest days of the summer as described in (CITATION). This captures the temperatures most physiologically stressful to plants
- AT1: Average soil temperature (°C) of the hottest time of the day(14:00-16:00) of the 5 hottest days of the summer as described in (CITATION). This captures the temperatures most physiologically stressful to plants
- MT1: Highest soil temperature (°C) of the hottest time of the day(14:00-16:00) of the 5 hottest days of the summer as described in (CITATION). This captures the temperatures most physiologically stressful to plants
- Canopy: Canopy cover (%) recorded at each subplot in four cardinal directions and averaged by plot
- CONBAA: Basal area (m2) of all live coniferous trees in the plot
- DECBAA: Basal area (m2) of all live deciduous trees in the plot
- BAD: Basal area (m2) of all dead trees in the plot (decay classes 1-5)
- BAA: Basal area (m2) of all living trees in the plot
- BAT: Basal area (m2) of all trees in the plot
- Saps: Count of all trees taller than 1.3m, with a DBH <9.1cm in the plot
- Cover: Total understory cover (%) in the plot
- Forb: Cover of non-grass herbaceous plants (%) in the plot
- Shrub: Cover of all shrubs (%) in the plot
Initial Data Visualization

Figure 10. Species cover distribution of select understory
species. The data is heavily zero inflated, making my project particularly suited to distance-based analyses, as they are non-parametric
|

Figure 11. Distribution of total understory covers (%). While the data is not normally distributed, there are no huge outliers. The cover value >120% was checked to make sure there werent any data entry errors that inflated the cover value.
|

Figure 12. Distribution of deadwood volume (m3) catagories. Note the non-normal right-skewed distribution
|

Figure 13. Distribution of log-transformed deadwood volume (m3) catagories. The log transformation was applied to correct the outlier distribution
|

Figure 14. Distribution of tree basal area (m2) attributes: Living conifer basal area (CONBAA), Living deciduous basal area (DECBAA), total living basal area (BAA), and total basal area (BAT). Note CONBAA and BAT have both been transformed with square root to improve their distribution
|

Figure 15. Distribution of average and maximum soil temperature (AT1, MT1) and average and maximum forest floor temperature (AT2, MT2), measured in °C. The low AT2 and MT2 value was checked for validity.
|
In order to evaluate the correlations between different forest variables, I used a principle component analysis, displaying a total of four axes that explain 68.3 % of the total variation. These plots will also be used to eliminate redundant variables for the understory species composition gradient analysis.

Figure 16. Principle component analysis of forest structure data, displaying principle components 1 & 2
|
PC1 is a gradient of tree cover and tree mortality. The negative side of the PC1 axis is plots with high canopy covers, and high amounts of living tree basal areas. The positive side of the PC1 axis contains plots with a lot of dead trees and coarse woody debris. The positive side of PC2 is mostly comprised of plots with high understory covers and/or high basal areas of deciduous trees. The negative side of PC2 is plots with high coniferous tree basal areas and high microclimatic temperatures (Figure 16). The positive side of PC3 is plots with high conifer basal areas, and high overall basal areas. The negative side of PC3 is sites with high understory cover, and high microclimatic temperatures (Figure 17). The positive side of PC4 is comprised of plots with slightly higher temperatures, high understory cover, and high total and deciduous basal areas. Opposite this on the negative side of PC4, we have sites with high live confier basal areas (Figure 18). Overall, all of the deadwood volumes and dead tree basal area variables are highly correlated throughout all the axis. Additionally, the maximum and average temperatures of both soil and forest floor air temperature were highly correlated with each other. Due to some redundancy in explanatory variables, BAD, MT1, and MT2 will be dropped from the gradient analysis as there are other variables that explain similiar variation. Cover, Shrub, and Forb variables will also be dropped for the gradient analysis to avoid confounding explanatory and response variables.
|
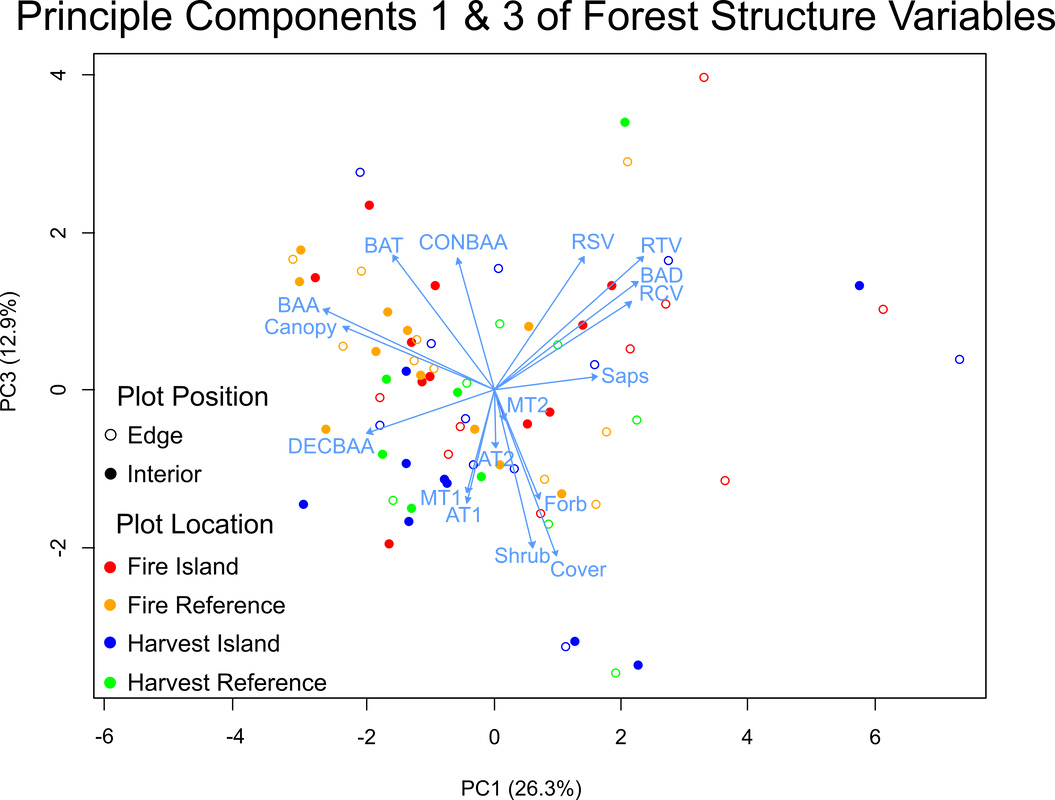
Figure 17. Principle component analysis of forest structure data, displaying principle components 1 & 3
|
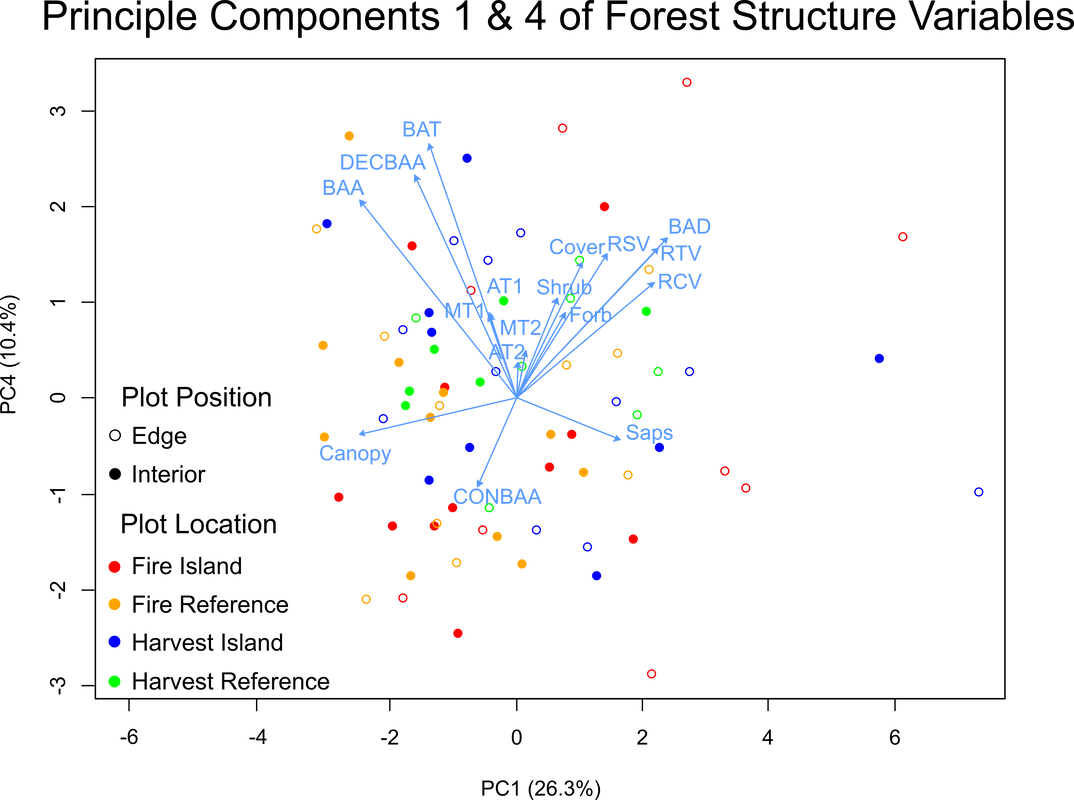
Figure 18. Principle component analysis of forest structure data, displaying principle components 1 & 4
|
